Traffic Analysis
Standard network tools show averages: 100 Mbps throughput, 20ms latency. But timing-sensitive systems care about variance—the gaps between packets, the bursts, the moments when nothing arrives. A stream can average 100 Mbps and still stutter if packets arrive in clumps.
The Charts tab shows what your system actually experiences.
Throughput
Shows bitrate or packet rate over time. Use the Series dropdown to switch between:
- Rx Bitrate — incoming bits per second
- Tx Bitrate — outgoing bits per second
- Rx Packet Rate — incoming packets per second
- Tx Packet Rate — outgoing packets per second
The Y-axis auto-scales to fit the data.
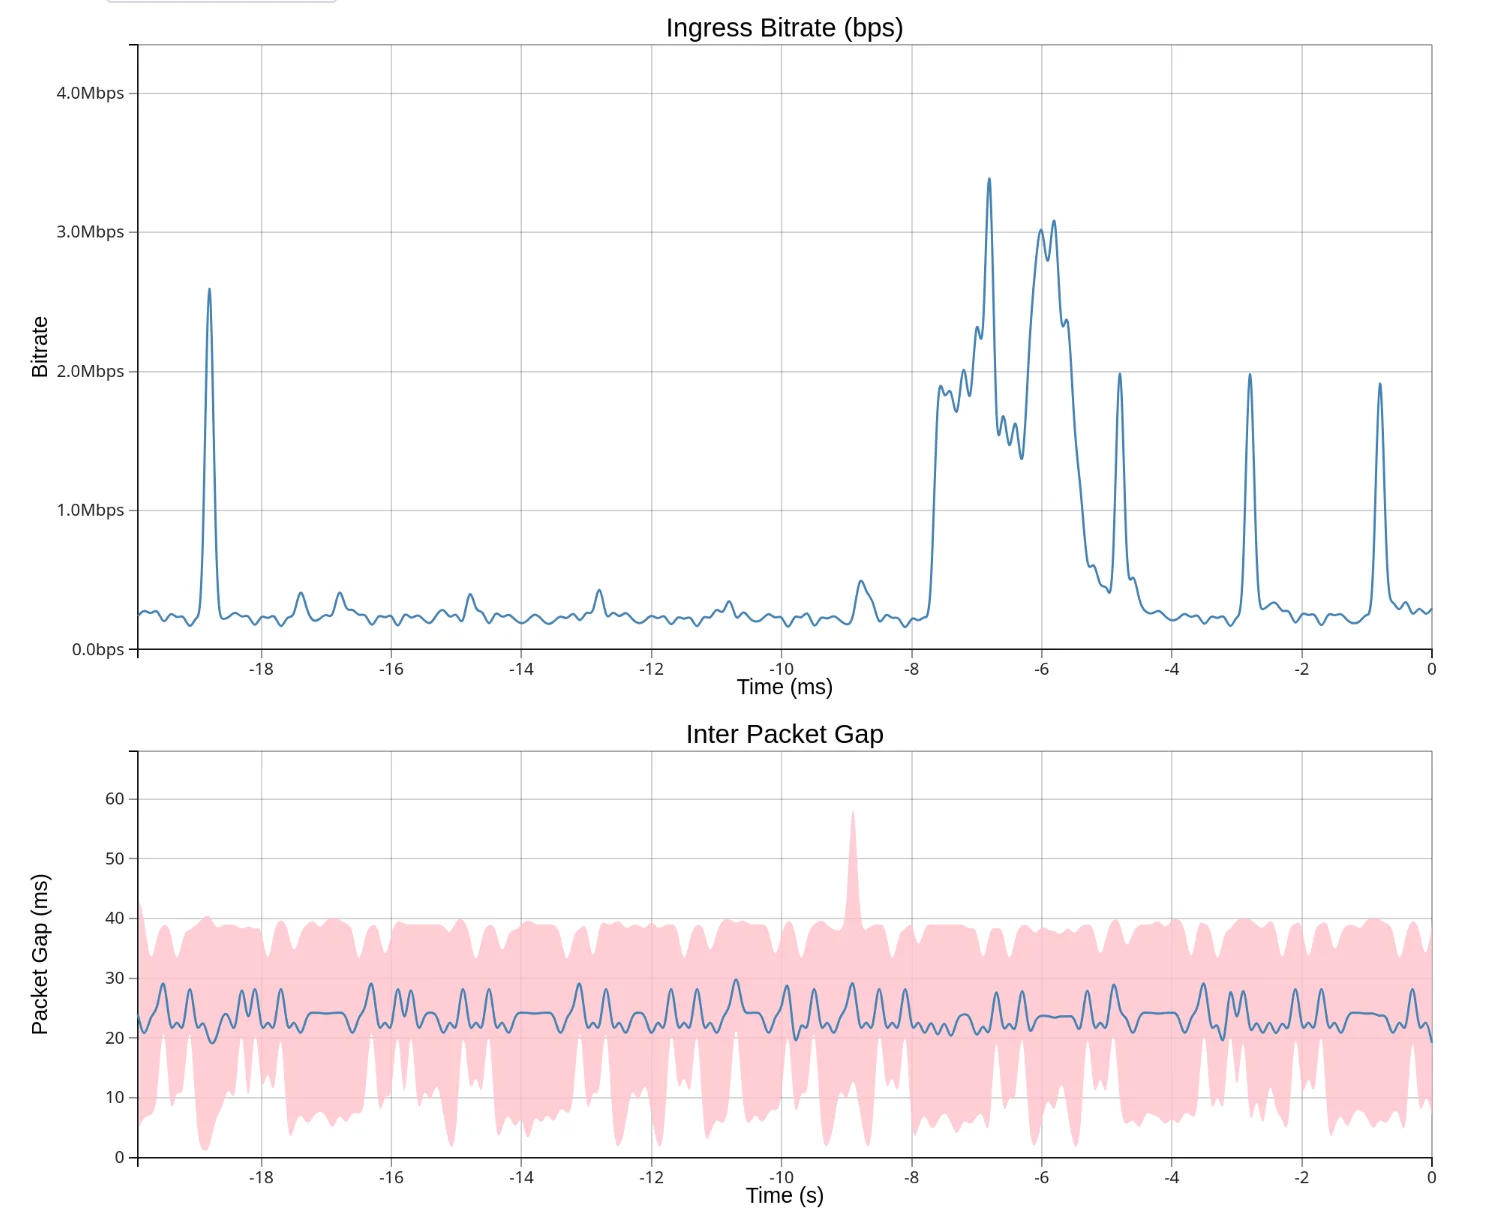
Packet Gap
Shows the time between consecutive packets (inter-packet gap). Useful for detecting:
- Gaps in traffic from buffering or scheduling issues
- Periodic pauses that might indicate application behavior
- Network problems causing packet bunching or delays
Spikes indicate periods with no packets. The blue line shows the mean packet gap, while the pink shading shows the min/max range observed during each sampling interval.
Top Talkers
Shows bandwidth usage broken down by flow (source/destination IP address and port). Each flow gets a unique color. Hover over the legend to see flow details. The legend also shows the current RTT for TCP flows.
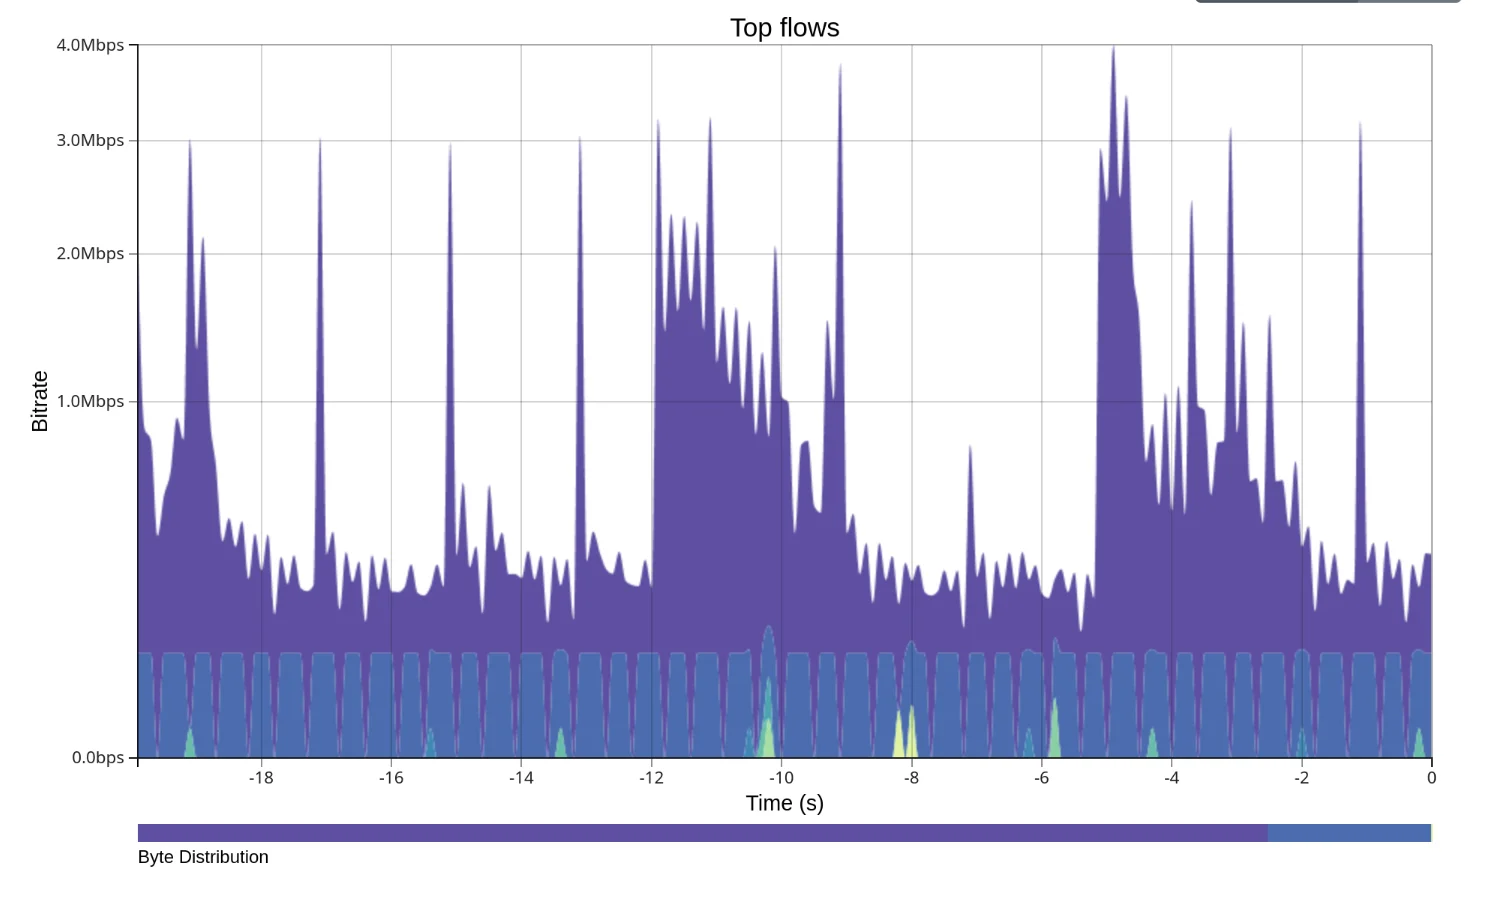
Use the Y-Axis Scale toggle to switch between:
- Logarithmic — better for mixed traffic with high and low bandwidth flows
- Linear — better for comparing flows of similar magnitude
Controls
| Control | Description |
|---|---|
| Interface | Select which network interface to monitor |
| Interval | Chart time resolution in milliseconds (10ms-1000ms) |
| Pause/Run | Freeze charts to examine data, or resume live updates |
| Capture | Trigger a packet capture download |